A. Enhancement of Raman signal [1-4]
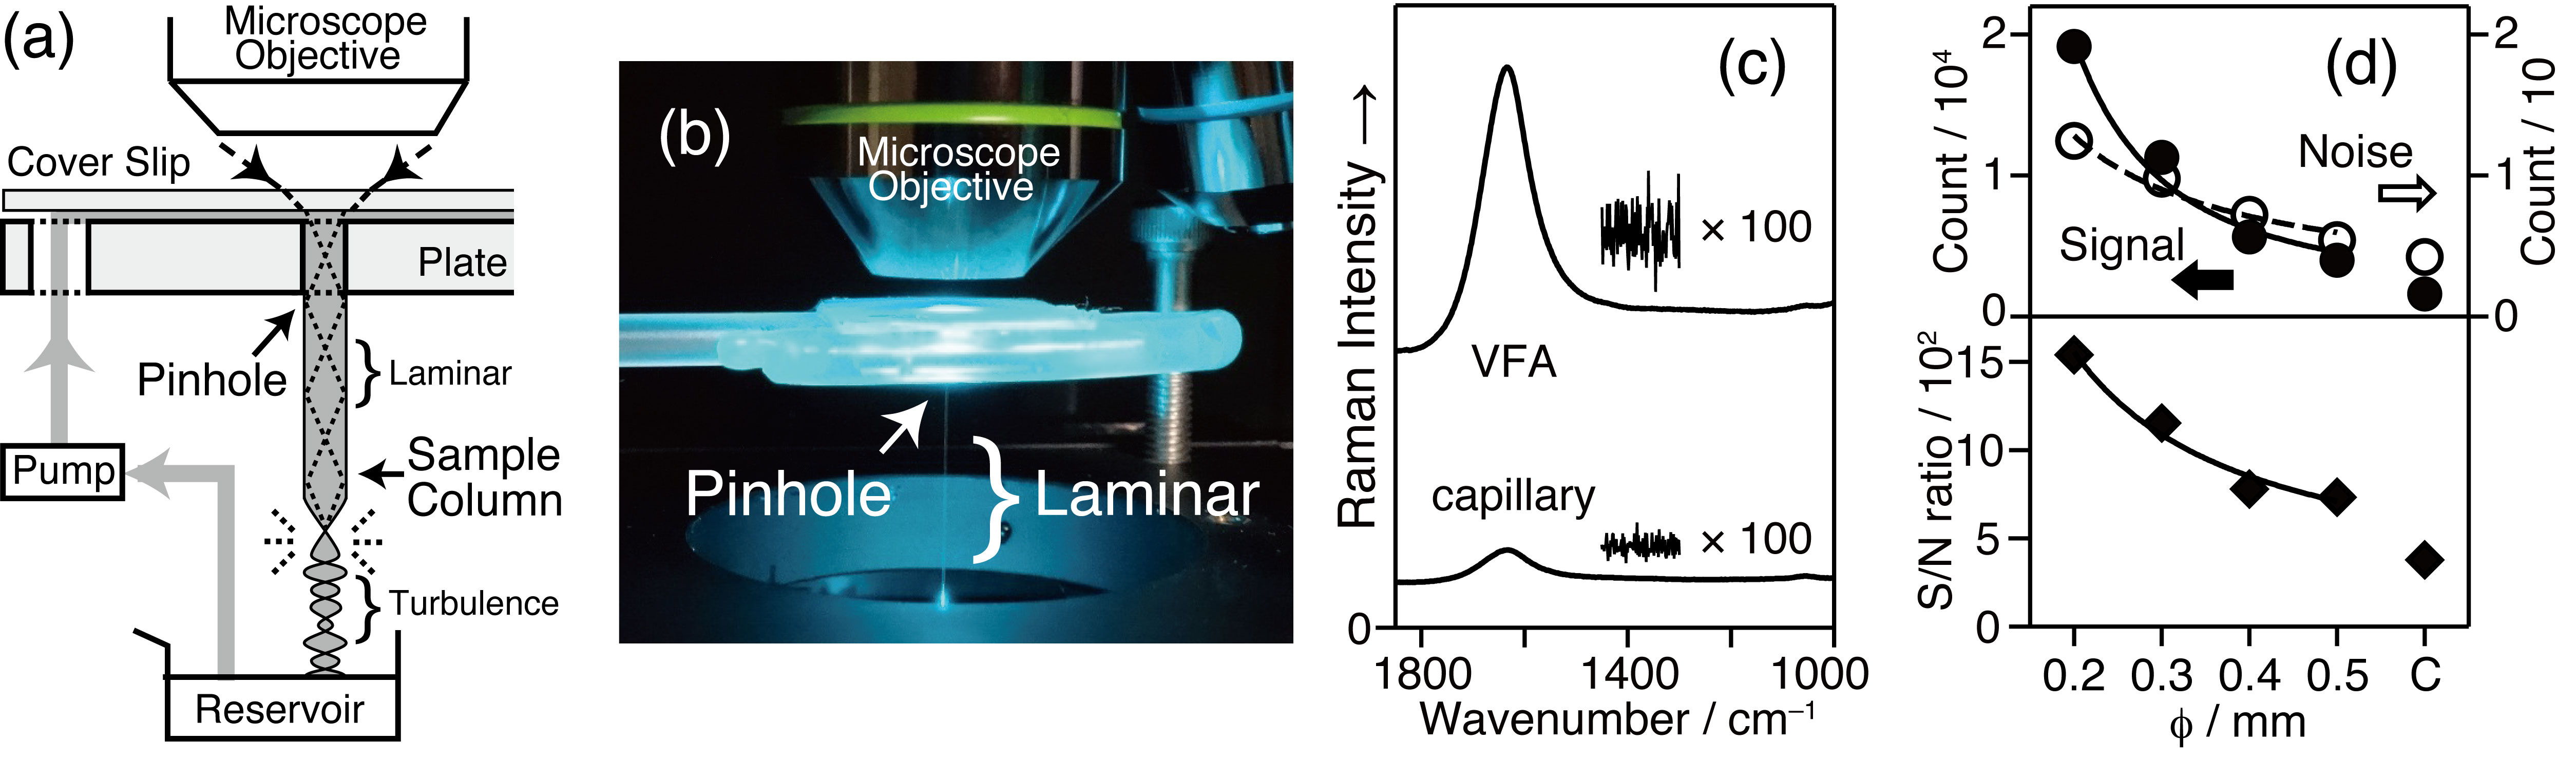
Raman spectroscopy has been applied to biochemical studies. The Raman signal of biomolecules is often weaker than the contribution from H2O, and therefore, careful experiment and data analysis has been required. Raman spectroscopy will be utilized more in this field by improving the sensitivity of the signal detection. We made a sampling unit to make a vertical flow column of the sample solution (Figures(a and b)) [1]. Using a lens having large numerical aperture value, we introduced the excitation beam from the top of the column.
This setup allowed the enhancement of Raman signal up to 12 times in 2014 [1], 90 times in 2019 [2], and 168 times in 2024 [3]. It enabled the efficient sampling (Fig. (c)). It is shown that the signal enhancement factor is a function of the pinhole size (Fig. (d)), the NA value of the focal/collection lens, and the laminar flow length. The total reflection of the excitation beam and the generated Raman signal in the column explains the enhancement, since the sample column acts as core of an optical fiber surrounded by "air" as the cladding material (as known as the liquid-core waveguide) [4].
By applying this method to the Raman measurement of bovine serum albumin in aqueous solution, we have succeeded in recording the spectrum of the sample as low as 0.03 mg/ml; the limit of detection was determined to be 0.029 ± 0.003 mg mL–1 (0.44 ± 0.05 µM). Nearly two-order improvement was achieved [2].
B. LC-Raman Analysis [5-8]
Coupled methods of a separation technique and an online spectroscopic detection technology (also known as “hyphenated techniques”) offers a powerful tool for the analysis of complexed samples. Liquid chromatography (LC) as the separation technique has been combined with several spectroscopic detection techniques, namely, UV–Vis spectroscopy, fluorescence spectroscopy, mass spectrometry, electrochemistry, and nuclear magnetic resonance spectroscopy.
The combination with the Raman spectroscopy (LC-Raman) was not easy because of low signal detection sensitivity. We employed the vertical flow method to efficiently collect the Raman signals and succeeded in combining them. The LC-Raman setup enabled the online acquisition of the non-resonance Raman spectrum of LC eluates using reverse-phase [5] and hydrophilic columns [6]. Besides, the programmable LC pump was used to change the mixing ratio of binary aqueous solutions. The pH value was continuously changed, and the pH-dependent denaturation of bovine serum albumin was investigated in detail [7].
We employed singular value decomposition (SVD) and subsequent reconstruction of the components for the analysis of two-dimensional (temporal and spectral) data. The three geometrical isomers of methoxyphenol (that is, the ortho, meta, and para isomers) were separated well. The LC-Raman measurement enabled the quick and unambiguous separation of the geometrical isomers [5]. The limits of detection and quantitation were 1.2 ± 0.1, 2.1 ± 0.1, and 2.7 ± 0.1 mM and 4.1 ± 0.1, 6.9 ± 0.1, and 9.1 ± 0.2 mM for the ortho, meta, and para isomers, respectively. The non-resonance Raman experiment provides the molecular specificity to LC on the basis of the inherent properties of eluates.
The sugar content in honey was analyzed using the LC-Raman measurement.[8] We separated four sugars with LC and identified them with Raman spectroscopy. The contents were: Fructose 41.9%, glucose 33.1%, sucrose 6.9%, and trehalose 3.5%. Generally, it is difficult to distinguish these mono- and disaccharides spectroscopically because they do not have chromophores. Also, the molecular weight is exactly the same for the mono- and disaccharides, respectively (i.e., MS analysis is not available). The Raman spectrum as "the fingerprint of molecule" provides the clear evidence to identify the samples in the LC eluate.